
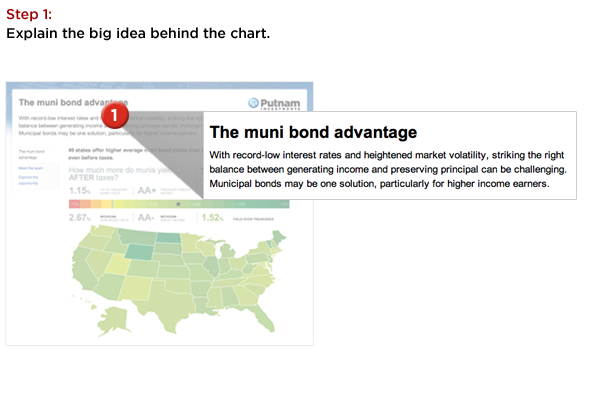
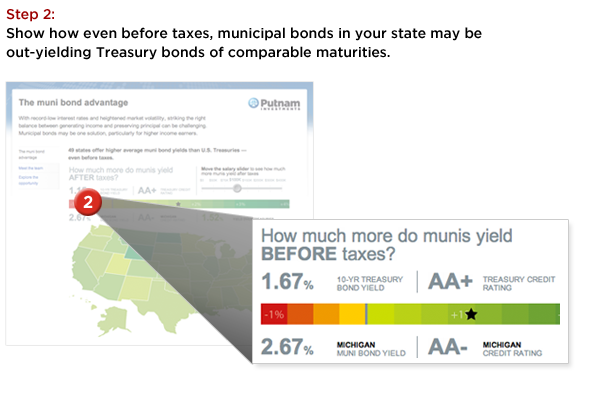
Infographics are a new take on an old idea, namely using charts as a way to visualize data. Today’s infographics are different in two respects: They often feature an element of interactivity, and they are increasingly sharable thanks to the Internet and a host of user-friendly applications. Here’s an example of how you can use Putnam’s inforgraphic on the advantage of muni bonds today.

Explore Putnam’s infographics.
This content is offered for informational purposes only and is not meant as an endorsement for any particular app, mobile device, or social networking site.